Allison’s public comment at final map hearing 4/24/24

I’m speaking for those left fallen through the cracks amidst other regional politics.

Last week my daughter’s teacher told me, “Keep fighting for us.”

She’s a US born graduate level educated Latina bilingual educator. She said to me, “I know my place. When I speak up for us Latinos in education I get dismissed or punished. When I need to advocate for bilingual education, I have my White teaching counterpart speak out for us because they’ll take her seriously. Allison, when you speak for us they’ll listen, they’ll believe you, and they’ll know you’re not acting out of self interest but because it’s the right thing to do.”

Mitla is a prehispanic archeological site deep in the Valle Central de Oaxaca, Mexico. This was the political and religious center of the Zapotec and Mixtec people with stone walls adorned with intricate friezes of polished cut stones fitted together without the use of mortar, uniquely only found in this location. During the 16th century Spanish conquest, missionaries built a church in the middle of it, leaving much of the site intact, only destroying “a little bit” of their most sacred place of worship, reusing the stones from the walls of Mitla to build the church and forcing the conversion of the people there. The church is now an integral part of the history and faith of that country, but I saw how locals ignored the hulking structure in the middle of the site when they talked about the significance of Mitla. The harm remains centuries later despite the intentions of that benevolent agenda.

I appreciate the efforts to approximate the Hispanic/Latino priority created by Maps 2-4 in subsequent scenarios, however, all of these come up short of the eliminated map scenario that prioritized Hispanic/Latino voting rights. It was wrong to compromise the district’s most underrepresented protected class under the California Voting Rights Act. Hundreds of Hispanic/Latino voters were left on the cutting room floor before the board could even vote on it.

 It will take a collective shift in our systems, culture, and values to truly invite family engagement and bridge persistent opportunity gaps from underrepresented groups in the district. It can be done – with critical thought, imagination, prioritization, and love

Allison’s response to release of Map 8

I appreciate the many efforts to come close to the prioritized Hispanic/Latino Citizens of Voting Age Population (CVAP) of 28.4% in Maps 2-4, including the recent addition of Map 8 with a Hispanic/Latino CVAP percentage of 28%. 

After the inclusion of Map 8, I am looking at the numbers of actual human Hispanic/Latino voters behind the percentage of Hispanic/Latino CVAP. Given the differences in estimated overall population of CVAP between each map scenario, the numbers of actual Hispanic/Latino citizens of voting age remains below the prioritization captured by the demographer in Map scenarios 2-4 and in the same range as that of Map 5 (528 voters less) and Map 6 (347 voters less) despite the percentage getting closer to 28.4%. Map 8 is still 419 Hispanic/Latino voting humans short of the prioritization created by Maps 2-4. Maps 2-4 were the most legally viable map scenario created by the demographer to maximize Hispanic/Latino voting rights and those maps have been eliminated for the board to vote on. The increase to 28% Hispanic/Latino CVAP only creates the perception of an increase in voting power. Please see my spreadsheet analysis in the two far right highlighted columns.

I acknowledge the efforts it takes to attempt to satisfy the many communities of interest and strong feelings on the topic. As a historically underrepresented protected class under the CVRA, Hispanic/Latino voting rights should be prioritized above other communities of interest such as attendance boundaries, feeder schools, regional politics, and townhome communities. 

Nonetheless, I give a lot of credit to the incredible efforts of the board, staff, and CTAD committee in doing the right thing to improve representation overall for the district. Thank you for your dedication to this difficult endeavor. 

Respectfully,

Allison Joe 

Follow up to Allison’s public comment at March 20 map hearing

This is a follow up on my public comment at the Mapping Hearing on March 20. I realize my perspective came as a surprise to many and there is a lot of nuance and complexity that may not have been captured in my 2-minute comment.

First and foremost I want to commend the CTAD committee, staff, and consultant on their incredible thought, care, community outreach, and hours of work put into synthesizing and developing the redistricting maps. It truly is a model of community engagement and transparency. They are well intended people doing important work.

My comment was intended as a critique of our systems of influence, how even when we all do exactly as we are supposed to do and do it well, we still end up leaving the same people behind, over and over again. It seems like small increments, but these increments add up over time, contributing to persistent disparities in representation and opportunities, specifically with historically marginalized and underserved groups like Hispanics/Latinos, especially those from lower income, monolingual Spanish speaking households who may have lower levels of formal education from their countries of origin.

Public input is dominated by those who send advocacy emails, make public comments, and organize community meetings. This will inherently favor the most empowered and most informed in the community. For a myriad of complex and perhaps confounding reasons, families like many of the immigrant Latino families that I know at my kids’ schools and throughout the community don’t use email and are very unlikely to attend board meetings or speak during public comments. Without default regular translation services, they would never be able to be informed or contribute to the process even if they wanted to. Under our current systems of influence, their voice will always be harder to reach and maximize. Their interests and perspectives repeatedly get subsumed by more dominant voices and interests.

CTAD members who presented at the San Miguel PTA meeting did a diligent job. It is also important to consider that this was the first time San Miguel families were presented with this topic and there are inherent challenges in translating complex information via an impromptu translator not familiar with the content. Some of these details are inherently confusing even when presented to highly educated English speakers. I can only imagine how much more confusing it is for immigrant families. Despite admitting they may not have fully understood the process, the consensus of parents via the PTA poll from that meeting was in support of whatever map created the largest Hispanic/Latino percentage. 

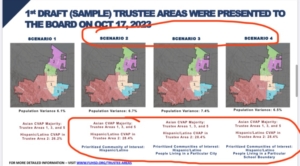
Based on the demographer’s presentation, the top Sunnyvale portion of maps 2-4 created the most viable, legally compliant map with a prioritized Hispanic/Latino CVAP of 28.4%. Considering that Hispanics/Latinos are a protected minority group under the CVRA, this map scenario should have at least been an option for the board to consider and vote on or would set the bar to meet in subsequent map versions with a Hispanic/Latino CVAP at 28.4%. Instead, the Hispanic/Latino CVAP was combined into the pool of variables to consider and it got compromised with the flood of other advocacy that came into CTAD as the committee synthesized input from other communities of interest. My understanding is that CTAD believes this was prioritized by going to great efforts to come as close as possible with a 27.7% Hispanic/Latino CVAP in maps 5, 6, and 7. However, when I discuss these numbers with Hispanics/Latinos, none of them feel “prioritized” with the close but lower CVAP percentage. They give an eyeroll and a sigh that reflects a sense of not being surprised yet still sad and dismayed. Latino educators responded with  “this is what always happens to us, especially in education.” Hispanics/Latinos are a protected group under the CVRA, as well as one of the most historically underrepresented and underserved in the district and should be prioritized above input from other communities of interest. If Hispanics/Latinos are not being prioritized, then they’re not being prioritized.

The area of Sunnyvale north of El Camino Real is a gentrifying community with a wide range of socioeconomic, cultural, and racial diversity. The Venn diagram of mutual interests and challenges of the children of American raised, English speaking, college educated, politically active professionals living in north Sunnyvale will not always align with those of Spanish speaking, Latinx immigrants, many with lower formal educational levels working as house cleaners, construction workers, gardeners, and restaurant workers who also live there. Every kid deserves the opportunity to do well, yet it is these children who persistently get left behind. 

In addition, due to Sunnyvale School District’s programs of choice which are designed to integrate students and families across neighborhood lines and build on the strengths in the district’s Title 1 schools, there is more crosstown integration between school communities and neighborhoods than would be captured by specific regional trustee areas. 

If there is a challenging lack of consensus over what board representation for north of El Camino should look like, then that is a reflection of this vast diversity. There may be conflicting views in the community of what new trustee areas should look like, but ultimately it matters more where one’s heart is than where their home is.

With respect and best regards,

Allison Joe

Allison’s public comment at March 20 Map Hearing

I appreciate everyone’s dedication, care, and work on the redistricting process. Equity can look a lot of different ways with different outcomes and methods. It should always center the vulnerable and those who are the most marginalized by these processes. The fact that these maps created a trustee area that prioritized Hispanics/Latinos seems to have gotten dismissed. This is a specifically protected racial group under the CVRA and the group in the school district with the most historically persistent gaps in opportunity that also correlate with home language, income, and parent education level. 

Hispanic/Latino Citizen Voting Age Population;

Map 1: 26.2%

Map 2: 28.4%

Map 3: 28.4%

Map 4: 28.4%

Map 5: 27.7%

Map 6: 27.7%

Map 7: 27.7%

The work of equity means elevating the voices and serving the underserved on their terms. At meetings with Spanish speaking Hispanic/Latino parents, they communicated that they didn’t feel confident in their understanding of the process but would want the trustee area that created the largest concentration of Hispanics/Latinos. They may or may not have understood which maps accomplished this, but there was a consensus in their wishes. Subsequent versions of maps, although legal and prioritizing other community interests, came close but did not accomplish this. Advocates for equity should have helped them understand which maps matched their priorities and made sure these voices were elevated and prioritized.

Our systems are designed to dismiss and marginalize the powerless and invisible. We are all part of the system. Perhaps the difference between 28.4%, 26.2%, and 27.7% Hispanic/Latino representation were deemed too small to matter. Was that decided by Hispanics/Latinos? Or was it decided by people who had a seat at the table, who understood the processes, who organized the outreach, who could flood an inbox with advocacy emails, and felt empowered to make public comments, who decided for them, disempowering them in the process? It takes 50% +1 vote to win an election. Who decided their .7% didn’t matter? Probably not Hispanics/Latinos. 

The biggest barriers to educational social justice are 1) unconscious bias and 2) parents with privilege acting on the system in their own interests without realizing the unintended consequences for others who are more vulnerable. Are we a part of the problem or a part of the slow, difficult, uncomfortable path to shifting the systems that we are a part of to truly work better for everyone? If we’re not centering and serving the underserved, then we’re not centering and serving the underserved. 

Equity work is hard and we don’t always get it right. Good intentions are a start. When we know better, we can do better. Let’s do better.